I'll see your processing, and raise you one "multiplicative K factor".
I could make no sense of the Gama manual's "EXAMPLE" processing
( i.e. with their running-sum-K ) but I could understand the simple idea of:
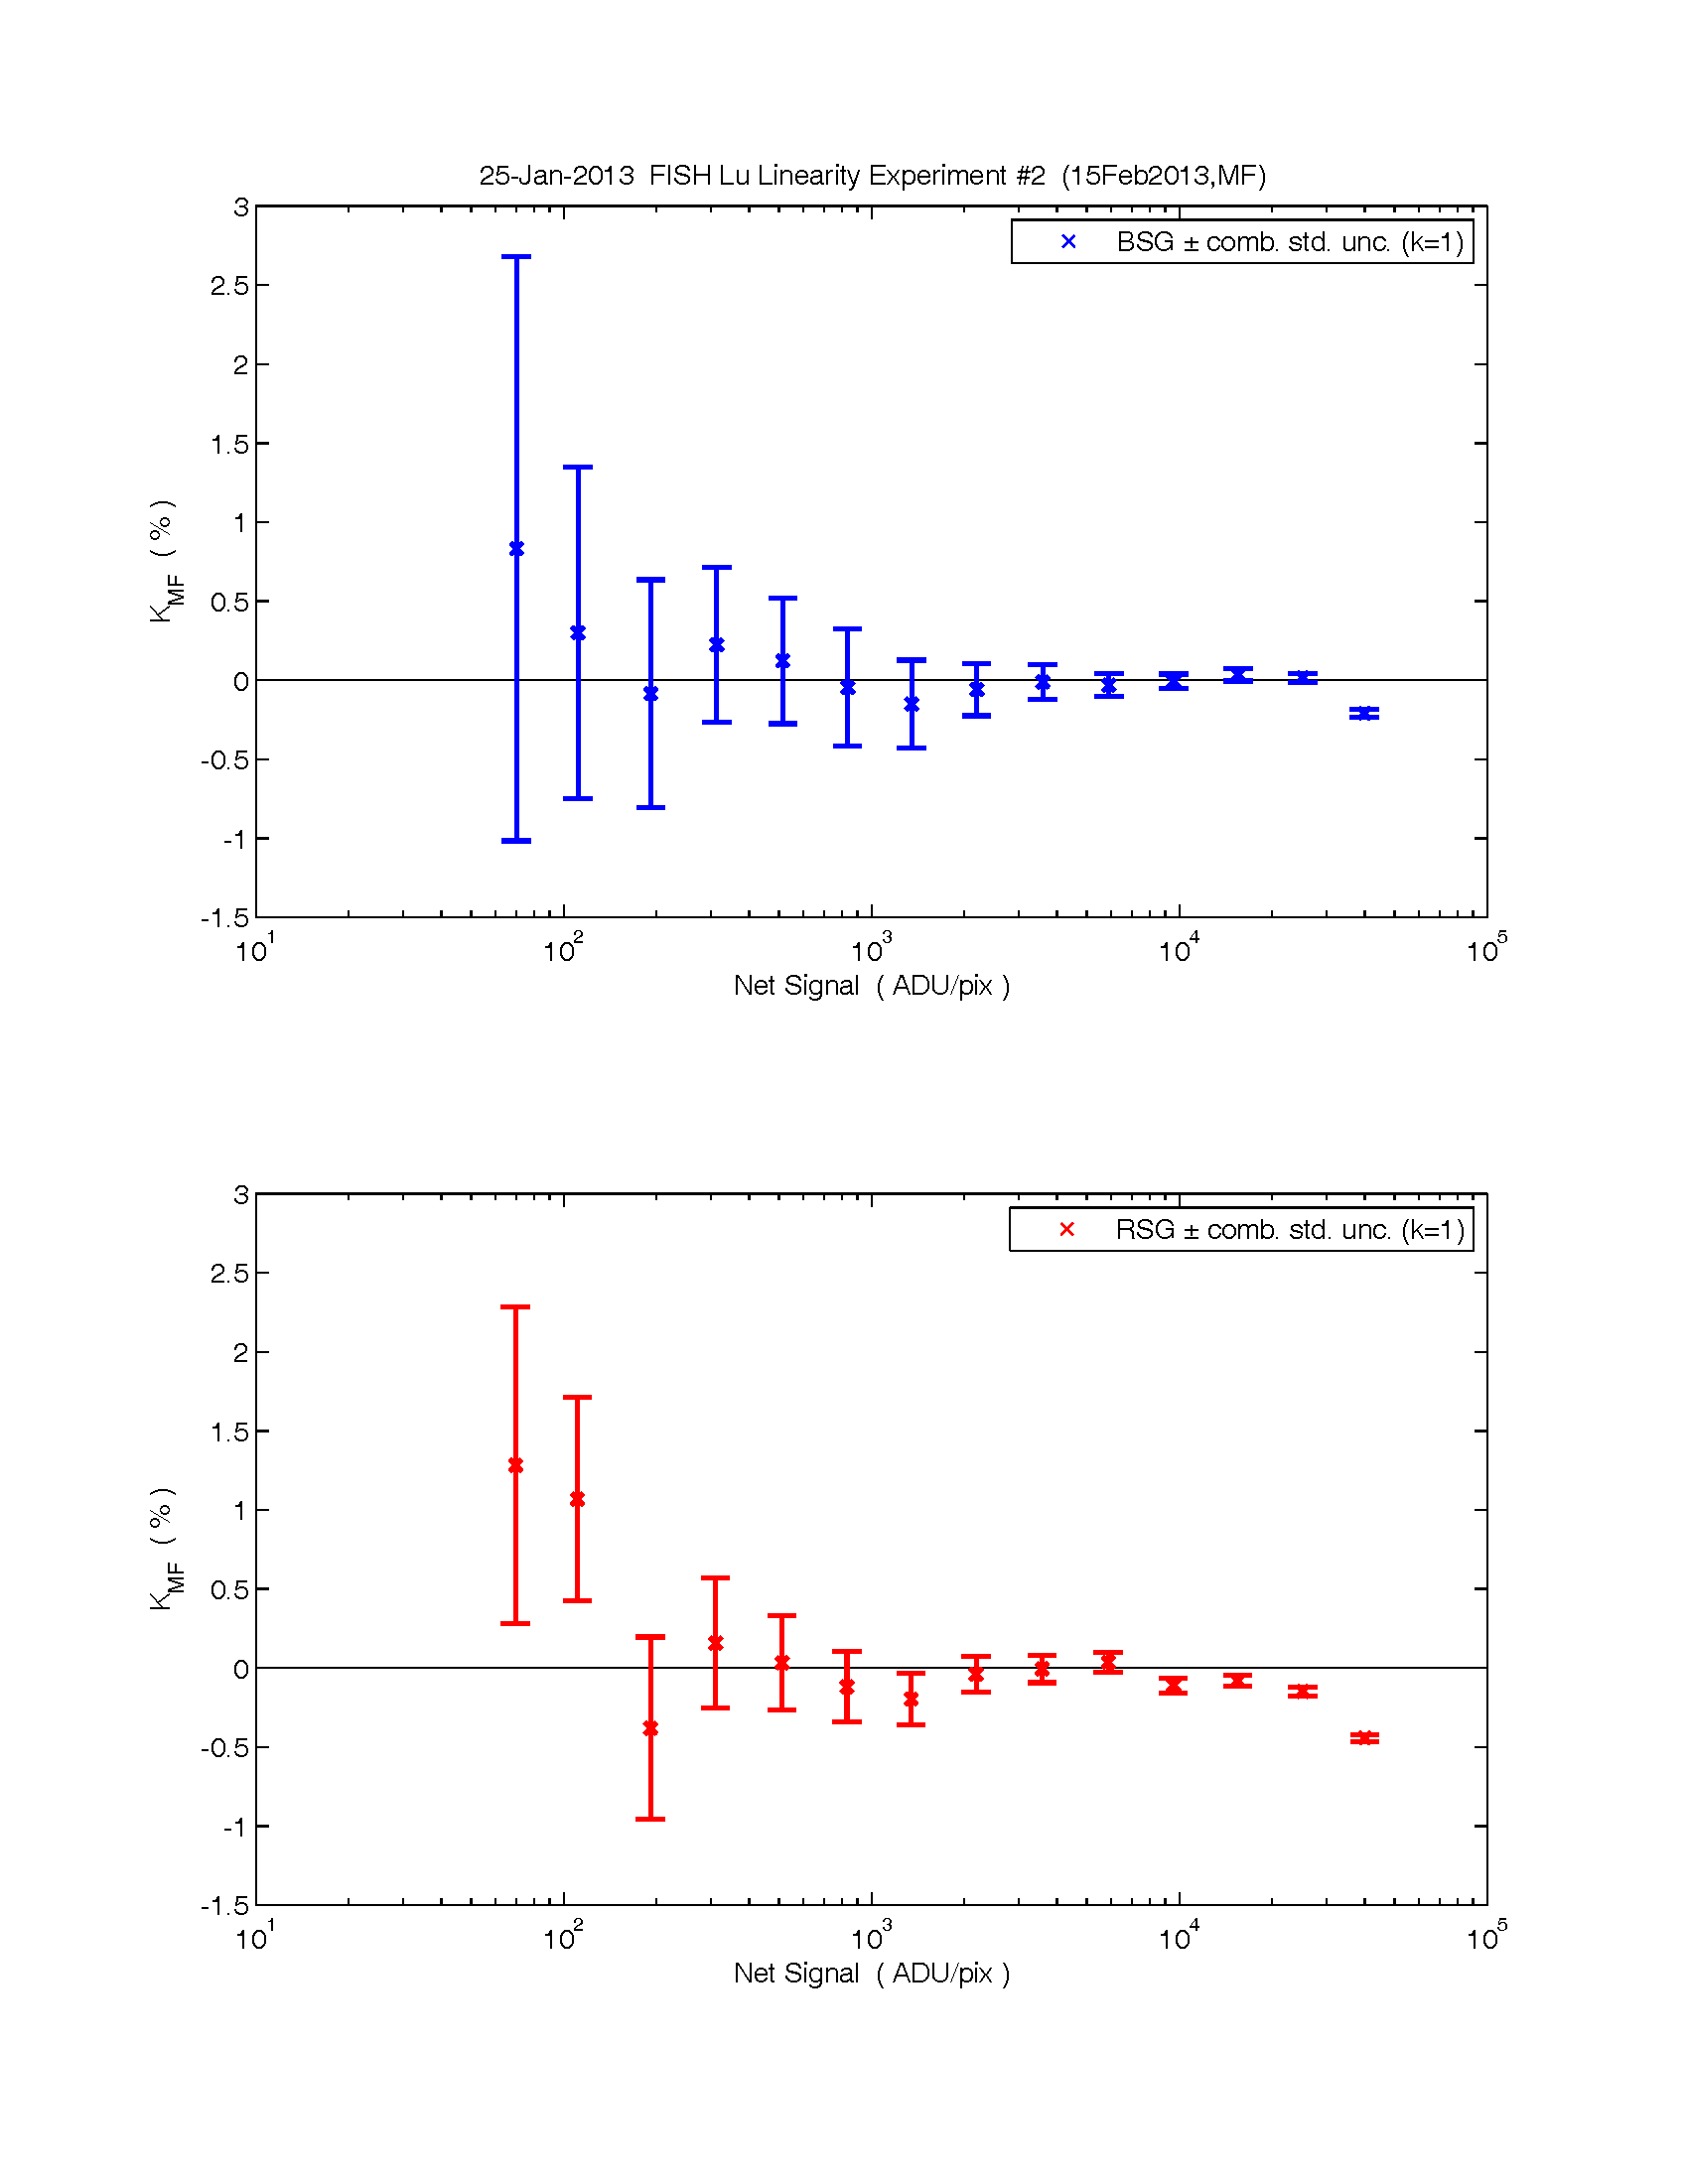
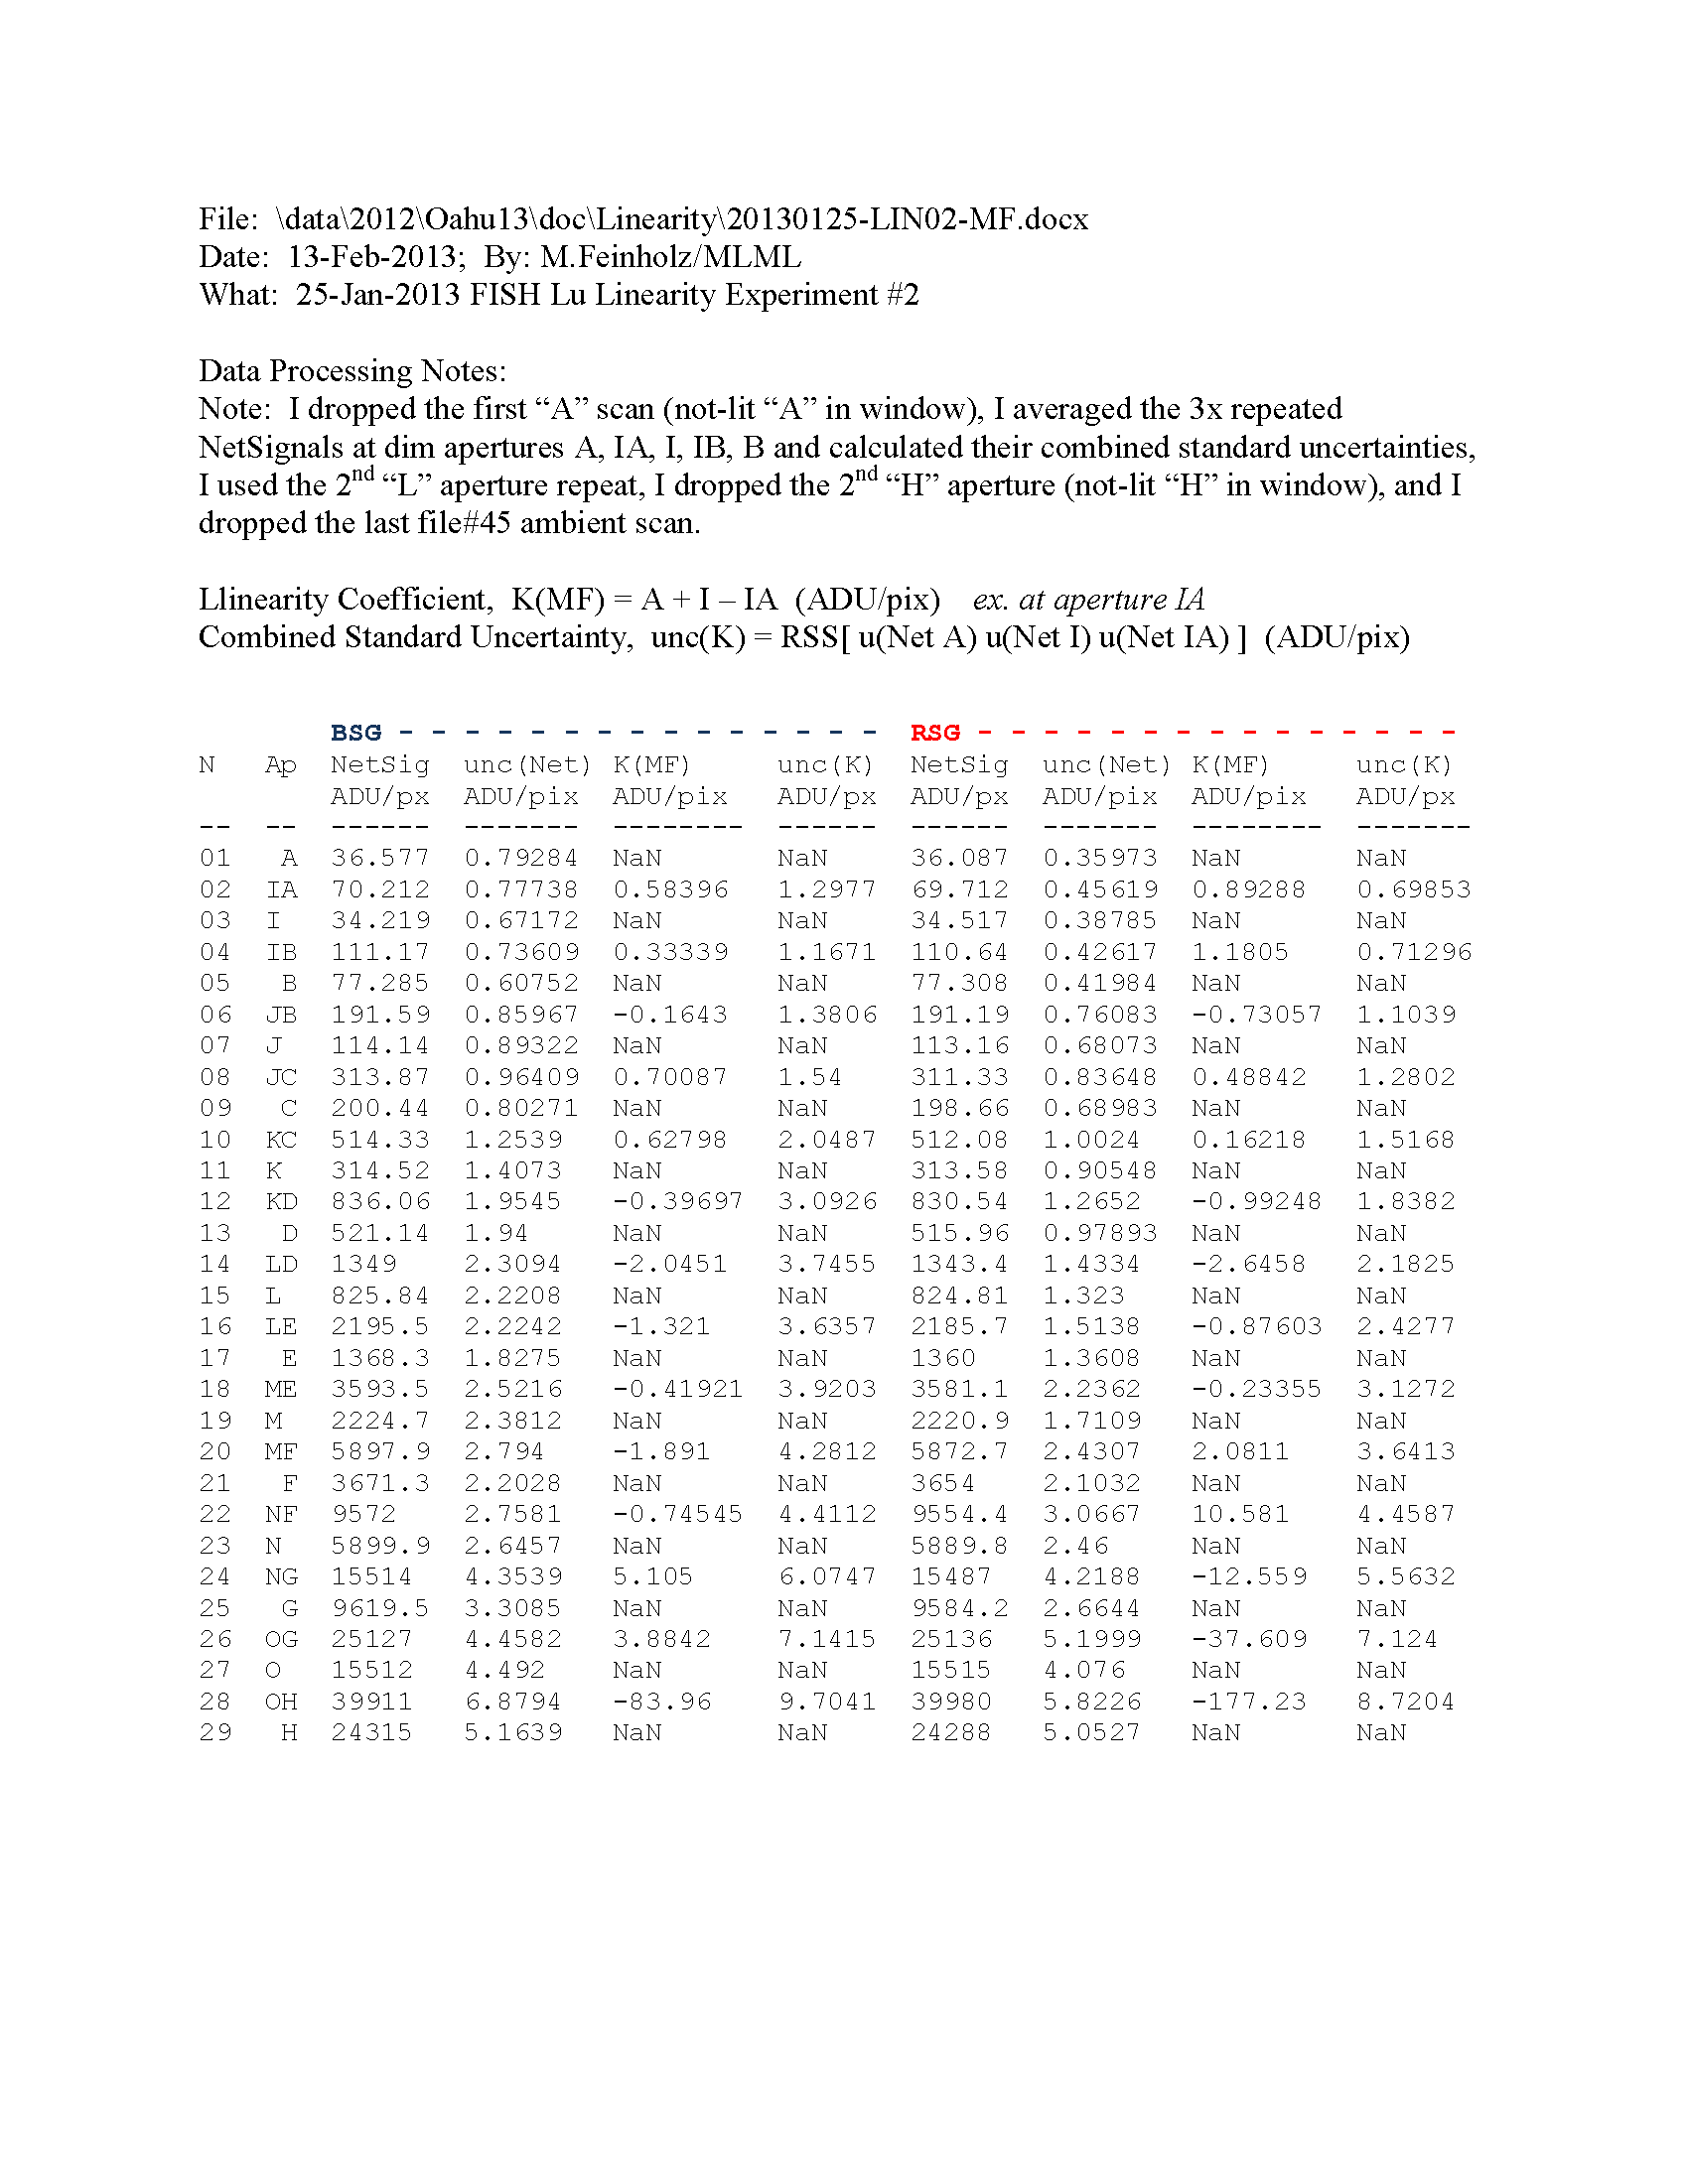
K = A + I - IA (ADU/pix), applied at the NetSignal level IA (ADU/pix)
and
unc(K) = RSS[ u(Net A) u(Net I) u(Net IA) ]
If one used this K to additively correct "IA", this forces IA+K == A+I.
...So, I used my NetSignal's and their combined standard uncertainties,
(processing steps from previous email) and plotted "percent K" with
+/- 1 errorbar <attached: 20130125-LIN02_03.png> -
"percent" because I normalized K & u(K) by "IA" NetSignal level.
FYI, data listing also attached: 20130125-LIN02-MF.png
I have the easiest time looking at .png files, but I have .pdf's of these
if you would like, and I have a .docx of the listing if you would like.
Note: At the first 5 dimmest apertures, A, IA, I, IB, B,
I acquired triplicate scan-sets, so for these I averaged the 3x NetSignals,
and their comb.std.unc. was RSS[ u(Net 1) u(Net 2) u(Net 3) ] / 3,
which REDUCED their unc (see leftmost plot sumbols & top of listing)
versus the rest of the apertures which w/ only 1x scan set...
It looks to me like that last "H" aperture might be amiss - I've looked at
the aperture box and it seems OK but I haven't opened it up...
Aloha, MF
parr wrote:
Carol,
I worked up the linearity data that Mike took and Stephanie put on the web. I analyzed it using the spreadsheet method you outlined based upon the Gamma manual. This data, except for the low signal region on both BSG and RSG looks pretty good and is what one would expect.
Attached are pdf plots an Kaliagraph plots of the data as well as the data spreadsheet in Kaliadiagraph format.
Al